- Home
- Sleeper Gold Project
Sleeper Gold Project
Winnemucca,
Nevada, USA
Overview
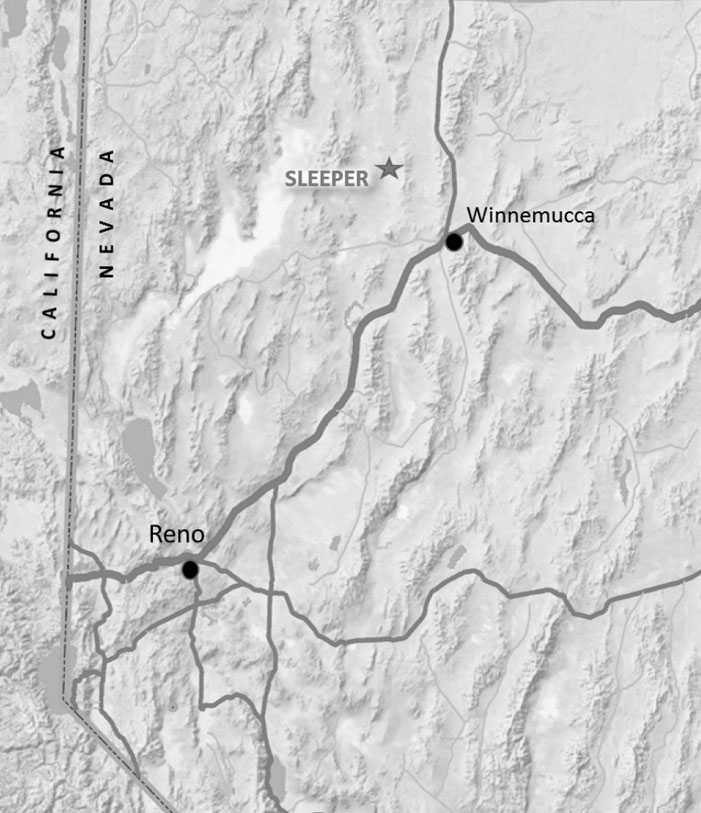
The Sleeper Gold Project is a 100%-owned, past-producing high-grade gold project located in Humboldt County, Nevada approximately 25 miles northwest of Winnemucca. The Project covers approximately 45,000 acres within the Northern Nevada Rift, a prolific gold-producing region that hosts numerous world-class gold deposits.
Historically operated by AMAX Gold from 1986 to 1996, Sleeper produced approximately 1.66 million ounces of gold and 2.3 million ounces of silver. The Project benefits from significant existing infrastructure and extensive historical operating data.
In June 2026, Paramount completed an Initial Assessment, prepared in accordance with S-K 1300, outlining a potential restart of the mine through the processing of mineralized surface materials and mining of oxide and mixed mineral resources utilizing conventional open-pit mining and heap-leach processing.
Project Highlights
• After-tax NPV (8%) of $402 million, IRR of 45% and 1.4-year payback at $3,600/oz gold
• After-tax NPV (8%) of $867 million, IRR of 66% and 1.2-year payback at $4,700/oz gold
• 17-year mine life with approximately 1.1 million ounces of payable gold production
• Mine plan includes approximately 47 Mt of mineralized waste dump material containing approximately 420,000 recoverable ounces of gold, supporting early production and cash flow
• Average annual gold production of approximately 65,000 ounces
• Approximately 348,000 ounces of gold production during the first five years at a low strip ratio of 0.74:1
• Measured and Indicated Mineral Resources of 1.99 million ounces of gold
• Inferred Mineral Resources of 2.30 million ounces of gold
Initial Assessment
The Initial Assessment contemplates a conventional open-pit mining and a 30,000 tonne per day crush-agglomerate-heap-leach facility with Merrill-Crowe recovery.
Results outline a compelling restart opportunity with strong projected returns, a short payback period and a 17-year mine life. During the first five years of operations, the Project is expected to produce approximately 348,000 ounces of gold and 1.33 million ounces of silver at a low strip ratio of 0.74:1, supporting strong early cash flow generation.
Over the life of mine, Sleeper is expected to produce approximately 1.1 million ounces of gold and 3.4 million ounces of silver.
Technical Reports

Mineral Resources
The 2026 Mineral Resource Estimate includes in situ oxide, mixed and sulfide mineralization, as well as mineralized surface material contained in waste rock dumps, heap leach pads, and the tailings storage facility.
The Project hosts 1.99 million ounces of gold in Measured and Indicated Mineral Resources and an additional 2.30 million ounces of gold in Inferred Mineral Resources.
| Category |
Tonnes (Mt) |
Au g/t |
Au Moz |
Ag g/t |
Ag Moz |
|---|---|---|---|---|---|
| Measured | 5.5 | 0.492 | 0.09 | 3.487 | 0.62 |
| Indicated | 179.2 | 0.330 | 1.90 | 3.842 | 22.1 |
| Measured & Indicated | 184.7 | 0.335 | 1.99 | 3.832 | 22.8 |
| Inferred | 238.0 | 0.301 | 2.30 | 3.403 | 26.0 |
NOTES:
1. The definitions for Mineral Resources in S-K 1300 were followed for Mineral Resources
2. The Mineral Resource estimate is reported on a 100% ownership basis.
3. The point of reference for the Mineral Resource is before the crusher (in situ).
4. Open Pit Mineral Resources are reported at a cut-off grade ranging from 0.074 g/t to 0.217 g/t Au, depending on area and constrained by a preliminary optimized pit shell with a pit slope angle of 45° for rock and 22° for alluvium and a bench height of 10 m.
5. The optimized pit shell and cut-off grades were generated by assuming metallurgical gold recovery ranging from 63.7% to 85.0% and silver recoveries ranging from 0.0% to 54.6%, standard treatment and refining charges, mining costs of $2.40/t moved for open pit, processing costs of $5.51/t oxide/mixed and $10.44 sulfide processed, and general and administrative costs of $0.46/t processed
6. Minimal mining width was 60 m for oxide/mixed material and 20m for sulfide material
7. Mineral Resources are estimated using a long-term gold price of $3,100 per ounce
8. Bulk density ranges from 1.5 t/m3 in the tailings storage area to 2.7 t/m3 for in situ material
9. Mineral Resources that are not Mineral Reserves do not have demonstrated economic viability.
10. Numbers may not add due to rounding.
Development Strategy
Paramount is evaluating a phased development approach at Sleeper, focused on processing heap-leachable materials from historical waste dumps and in-situ oxide and mixed mineralization.
A key component of the mine plan is the processing of approximately 47 million tonnes of mineralized waste dump material containing an estimated 420,000 recoverable ounces of gold. This material provides a significant source of early production and cash flow while reducing upfront capital requirements and supporting the Project's short payback period.
The Company plans to advance Sleeper through an $8.7 million program of engineering, metallurgical, environmental and permitting activities designed to support completion of a future pre-feasibility study. In parallel, the Company is evaluating additional work programs, including infill drilling of surface material, to support future resource updates and further optimize the Project.
Exploration Potential
Sleeper has seen limited exploration activity for more than two decades despite its approximately 45,000-acre land package within the Northern Nevada Rift.
In addition to opportunities to convert existing resources and expand heap-leachable inventories, the Company believes there is significant potential for new discoveries and resource growth across the broader property.
Additional surface materials and sulfide mineralization are not currently included in the mine plan and represent further opportunities for future growth and optimization.